Fitness Progress Charts: How to Track Weight Loss, Muscle Gain, and Workout Results
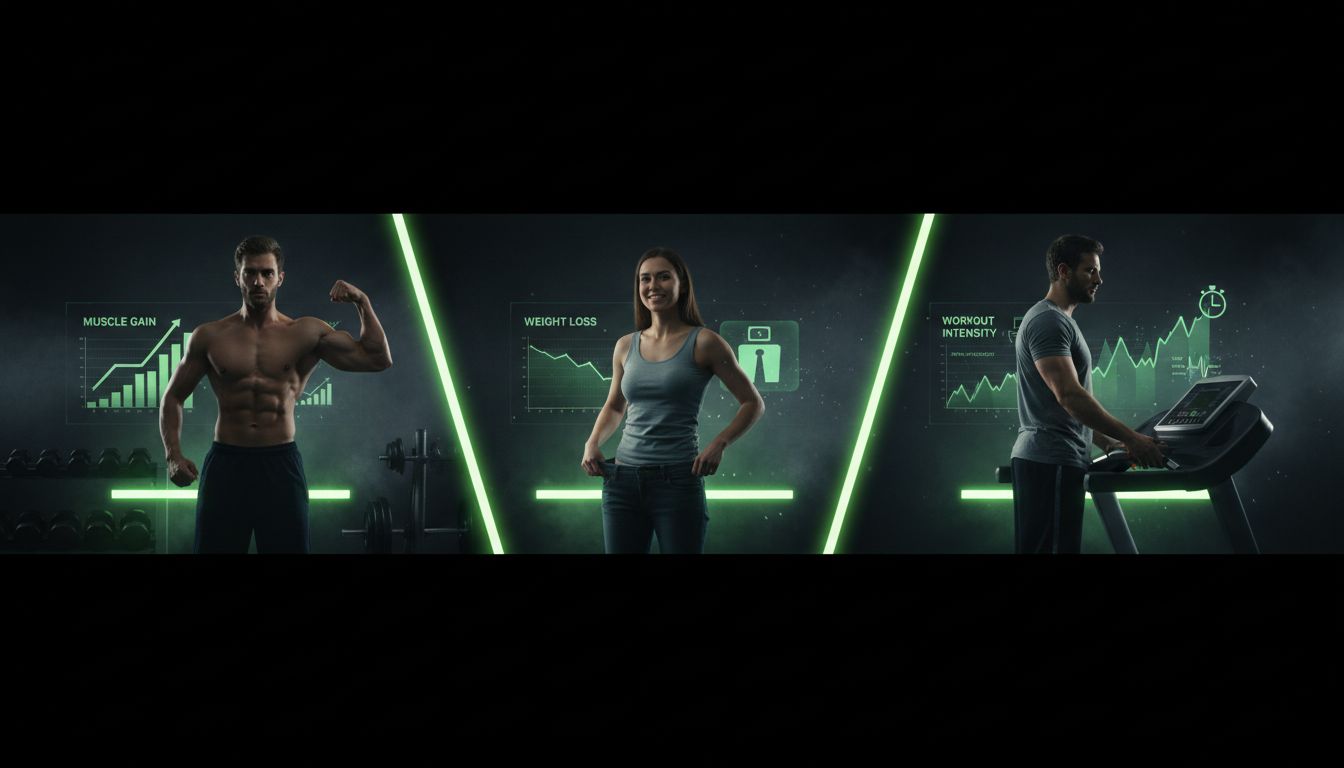
Fitness progress charts make it easier to see whether your training is actually working. A scale can bounce around because of water, sodium, stress, sleep, or a hard leg day, but a good chart shows the bigger picture. Used well, fitness progress charts can track fat loss, muscle gain, strength, cardio fitness, and even consistency with your routine.
What Is a Fitness Progress Chart?

A fitness progress chart is any organized record that helps you compare current fitness data with past data. It can be as simple as a notebook page or as detailed as a spreadsheet or app dashboard. The point is not to collect every possible number, but to record the right numbers often enough to reveal a trend.
A chart can be weekly, monthly, or tied to a training block. Some people use it as a body measurement tracker, others use it as a workout log, and many combine both. The format matters less than the habit of checking in the same way over time.
Common chart types include:
Weight trend charts for fat loss or mass gain
Body measurement trackers for waist, hips, chest, arms, and legs
Workout performance charts for sets, reps, and load progression
Transformation timelines for progress photos and milestone check-ins
Habit charts for workouts completed, protein intake, steps, or recovery
A useful chart should answer one question clearly: Am I moving toward my goal?
Why Tracking Progress Matters
Progress in fitness is not always visible from one workout to the next. Charts help you answer better questions than “Do I look different yet?” They show whether your plan is producing change, whether the scale is being influenced by normal fluctuations, and whether your training is building momentum.
A chart is especially helpful when progress is slow or subtle. You may not see obvious visual changes from day to day, but the numbers can show that your waist is shrinking, your squat is climbing, or your cardio pace is improving. If you prefer digital logging, Setgraph's workout tracker app can keep training history in one place so your chart is easier to update.
You can also use a chart to spot problems early. If your strength is dropping, recovery is poor, or your consistency is slipping, the data will often show it before motivation does. That makes it easier to adjust your plan before a small issue becomes a bigger one.
A good chart also reduces guesswork. Instead of changing workouts, cardio, or calories based on one frustrating day, you can look at the trend and make a calmer decision.
What to Track on a Fitness Progress Chart
A useful chart is not just a weight log. The best fitness progress charts match the metric to the goal. If you want a clearer picture, keep the chart simple enough to maintain and specific enough to matter.
Metric | Best For | How Often |
|---|---|---|
Body weight | Fat loss, mass gain, general trend | Daily or several times per week |
Waist, hips, chest, arms, thighs | Recomposition, physique changes | Every 2 to 4 weeks |
Progress photos | Visual changes | Every 2 to 4 weeks |
Sets, reps, and load | Strength and muscle gain | Every workout |
Pace, distance, intervals | Endurance and conditioning | Every workout or weekly |
Sleep, soreness, energy, stress | Recovery and readiness | Daily or weekly |
Workouts completed, steps, protein intake | Habit consistency | Daily or weekly |
A detailed workout log helps you connect results to the exact sets, reps, and loads you used. That matters because a vague memory of “I lifted hard last month” is much less useful than a clear record of what actually happened.
Body weight
Body weight is one of the simplest metrics to track, but it works best when you treat it as a trend instead of a single number. Daily weigh-ins can be useful if you look at the weekly average, not the individual day. That helps smooth out normal water fluctuations.
Body measurements
A body measurement tracker can reveal progress that the scale misses. For example, your weight might stay flat while your waist gets smaller and your shoulders or legs get fuller. That often happens during body recomposition, when you are losing fat and gaining muscle at the same time.
Progress photos
Photos are one of the most useful visual tools because they show shape and posture changes that numbers can miss. Take them under the same lighting, from the same angles, and in similar clothing. Front, side, and back photos are usually enough.
Strength markers
For strength training, track the lifts that matter most. That might include top sets, back-off sets, rep PRs, estimated maxes, or a 1RM estimate. If you want a cleaner strength marker, a 1RM feature can help turn a heavy set into a number you can compare over time.
Endurance and conditioning
If your goal is cardio improvement, track distance, time, pace, splits, or interval performance. Those numbers show whether your engine is getting more efficient, even if your body composition changes more slowly.
Recovery and consistency
Recovery data does not get enough attention, but it can explain a lot. Sleep, soreness, stress, and energy often explain why performance rises or falls. Habit data matters too. If you only complete two workouts a week when you planned for four, the chart will show that the issue is consistency, not effort.
Fitness Progress Chart Examples by Goal
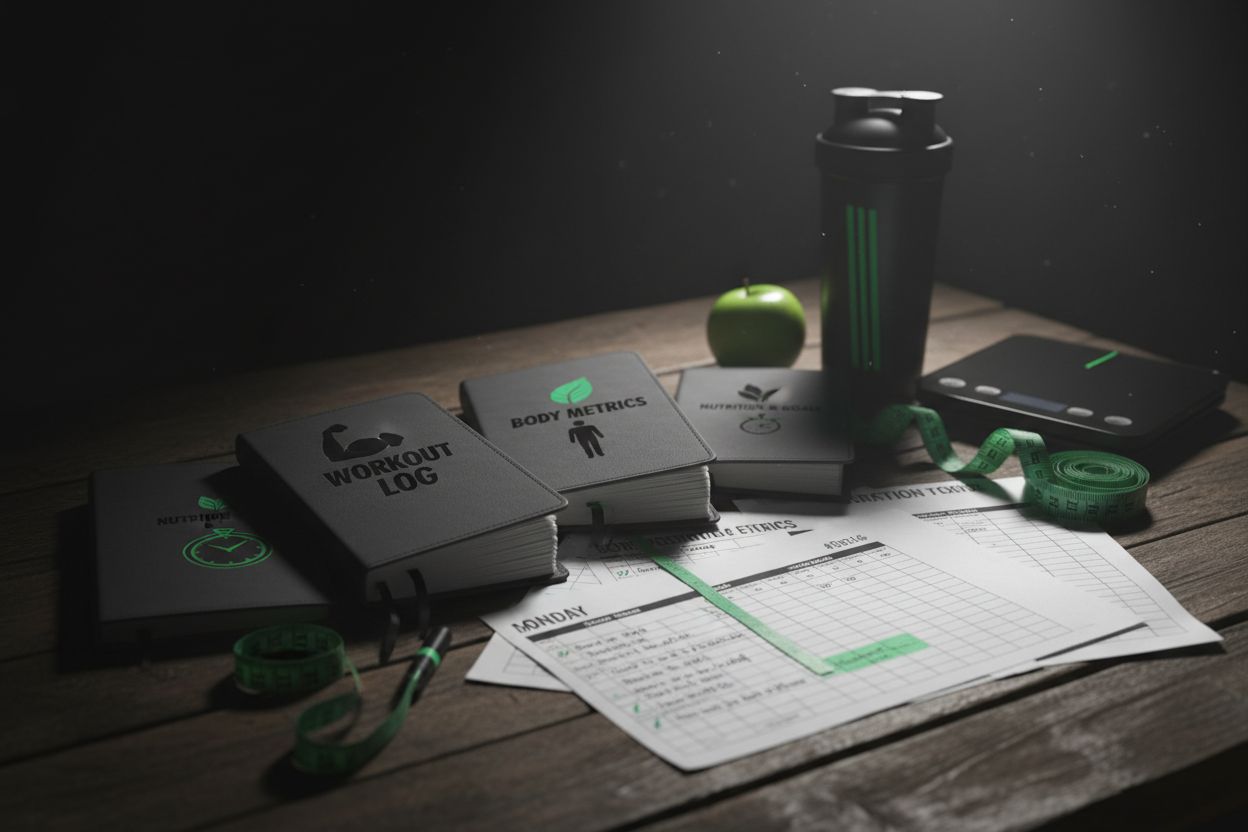
Different goals need different charts. The best chart for a marathon runner is not the same as the best chart for someone trying to add muscle, and that is exactly why a one-size-fits-all tracker often feels frustrating.
Fat loss
For fat loss, the most helpful chart usually includes:
Weekly average body weight
Waist measurement
Progress photos
Step count or daily movement
Workouts completed
This combination gives you a broader view than the scale alone. If body weight stalls for a week or two but your waist is shrinking, you are probably still making progress. That is especially important during the early phases of a cut, when water retention can mask real change.
Muscle gain
For muscle gain, track the numbers that show growth and training quality:
Body weight trend
Measurements for arms, chest, thighs, or shoulders
Key lifts and rep ranges
Training volume over time
Nutrition consistency, especially protein and calories
A muscle gain chart should help you see whether the scale is moving in the right direction and whether your lifting performance is supporting that change. If weight is rising too fast without better performance, the surplus may be larger than you need. If strength is climbing but body weight is flat, your training may still be working, just more slowly.
Strength
Strength-focused charts work best when they track a few core lifts with enough detail to show progress. Use a mix of top sets, reps, and load, then compare those numbers over time.
Good strength chart data can include:
Main lift used
Weight on the bar
Reps completed
Sets completed
Estimated 1RM or rep max
Notes about form, fatigue, or tempo
This is where a clean training log becomes especially valuable. A good record helps you see whether your improvement came from better programming, better recovery, or simply more consistent effort.
Endurance and conditioning
If your goal is cardio fitness, the chart should focus on output and repeatability. Useful metrics include pace, distance, average heart rate, split times, intervals, and recovery between efforts.
For example, if you run the same route every week, your chart may show that your pace improves even when your effort feels similar. That is real progress, and it is easy to miss if you are only judging by how hard the workout felt that day.
Habit consistency
Some people are not trying to chase a specific physique change right away. They just want to build a reliable routine. In that case, a chart built around consistency can be the best option.
Track:
Workouts completed per week
Protein target hits
Steps or active minutes
Mobility sessions
Sleep duration
Habit-based charts are simple, but they can have a huge impact because consistency is often the foundation for every other fitness goal.
How to Make a Fitness Progress Chart
If you are building a chart from scratch, start small. A chart that is easy to maintain is more useful than an impressive one you stop using after two weeks.
Pick one primary goal.
Decide whether your main focus is fat loss, muscle gain, strength, endurance, or consistency.Choose 3 to 5 metrics.
More than that, and the chart can become cluttered. Pick one main metric and a few supporting ones.Set your check-in schedule.
Daily, weekly, and monthly data should not all be updated at the same rate. Match the schedule to the metric.Record a baseline.
Start with a current body weight average, current measurements, photos, or training numbers before making changes.Keep conditions consistent.
Weigh yourself at the same time, measure in the same place, and take photos under similar lighting.Review trends, not single entries.
One bad workout or one high scale reading does not mean much on its own.Adjust one variable at a time.
If progress slows, make one clear change, such as adding steps, improving sleep, or changing your calorie target.
If you plan sessions ahead, pairing your chart with a workout planner can make it easier to connect training choices with the results you see later. That is especially helpful if you want to know whether the plan itself needs adjusting.
A simple chart template you can copy
You can build this in a notebook, spreadsheet, or app:
Field | What to record |
|---|---|
Goal | Fat loss, muscle gain, strength, endurance, or consistency |
Check-in date | Same day and time each week or month |
Body weight | Daily readings or weekly average |
Measurements | Waist, hips, chest, arms, thighs |
Performance | Main lifts, reps, pace, distance, or intervals |
Recovery | Sleep, soreness, stress, energy |
Notes | Travel, illness, deloads, diet changes, cycle changes, or anything unusual |
The chart should help you make decisions, not just collect numbers.
Printable vs Digital Progress Charts
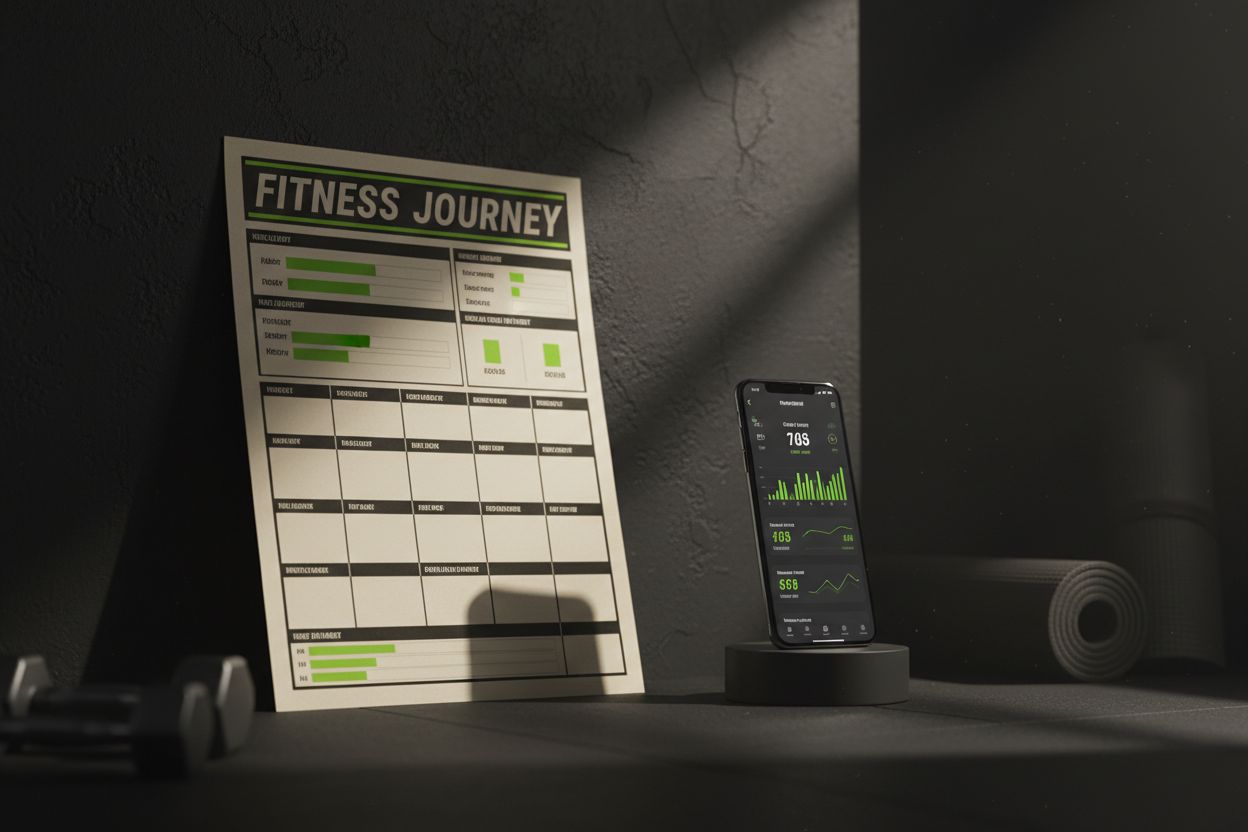
Printable and digital charts each have strengths, and the best choice depends on how you like to work.
Printable charts
Printable charts are simple, visible, and easy to stick to. They work well if you want something on your fridge, in your gym bag, or taped to a wall near your training space. A paper chart can be especially motivating because it is hard to ignore.
Digital charts
Digital charts are better if you want automatic calculations, trend lines, and easy backups. Spreadsheets are flexible, and apps can reduce friction by putting all your training data in one place. Digital formats are also easier to search when you want to review older training blocks.
Which one is better?
The best format is the one you will actually use. A simple printable tracker is often a better first step than an advanced dashboard that feels too time-consuming. Many people start with paper, then switch to a digital system once they want deeper analysis.
How Often Should You Update It?
The right update schedule depends on the metric.
Body weight: daily or several times per week, then review the weekly average
Measurements: every 2 to 4 weeks
Progress photos: every 2 to 4 weeks
Strength data: every workout or once per week
Endurance data: every workout or weekly
Habit tracking: daily or weekly
Consistency matters more than frequency. A chart filled in on a regular schedule will tell you far more than one updated in bursts whenever you remember it.
Common Mistakes to Avoid
Even the best fitness progress charts can become confusing if you use them the wrong way. A few common mistakes are easy to avoid.
Tracking too much at once
If you try to monitor every possible metric, you may end up with a chart that is hard to read. Start with the few numbers that matter most.
Comparing random conditions
A weigh-in after a salty dinner, a late night, or a hard leg session is not the same as a fasted morning weigh-in. Use the same conditions whenever possible so the trend is easier to trust.
Judging progress too early
Fitness changes usually happen slower than people want. A week is often too short to judge a real trend, especially for body composition.
Ignoring recovery
If sleep, stress, and soreness are not included anywhere in the chart, you may miss the reason progress slowed. Recovery is part of the process, not an afterthought.
Focusing only on the scale
Weight is useful, but it is only one part of the picture. Measurements, photos, and performance often tell you whether the scale is being honest or just noisy.
Changing everything at once
If you change training, cardio, calories, and sleep habits all at once, it becomes hard to know what actually worked. Make measured changes, then watch the chart for the result.
FAQ
How often should I update a fitness progress chart?
It depends on the metric. Body weight can be tracked daily, measurements and photos usually work best every 2 to 4 weeks, and strength data should be updated every workout or at least weekly.
What is the best metric to track?
The best metric is the one that matches your goal. For fat loss, body weight trends and waist measurements are useful. For muscle gain, strength numbers and body measurements often matter more. For endurance, pace and distance are key.
Can I track progress without weighing myself?
Yes. You can use progress photos, measurements, workout performance, endurance data, and habit tracking. That approach is especially useful if weighing yourself causes unnecessary stress.
Why do my numbers stall even when I am training hard?
Short stalls are normal. Water retention, stress, poor sleep, poor recovery, and changes in food intake can all hide progress temporarily. Look at the trend over several weeks before making a big change.
What should I do if my chart stops moving?
First, check whether your measurements, photos, or performance are still improving. If everything has stalled for several weeks, review your consistency and change one variable at a time, such as training volume, calories, steps, or sleep.
Are fitness progress charts only for people trying to lose weight?
No. They are useful for fat loss, muscle gain, strength, endurance, and habit-building. In fact, people often get better results when they use a chart because it shows progress that the mirror alone can miss.
The best fitness progress charts are simple enough to maintain and specific enough to guide decisions. Whether you use paper, a spreadsheet, or a digital tool, the real value comes from looking at the trend, not obsessing over one number.
Article created using Lovarank